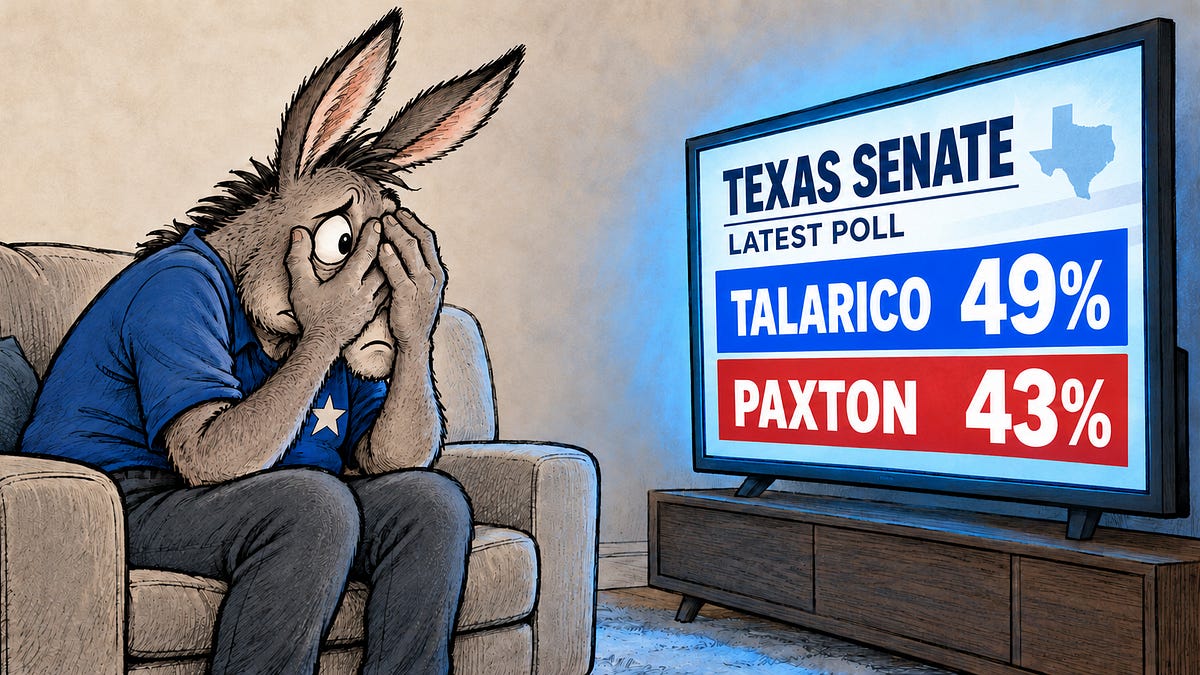
At FiveThirtyEight, we sometimes experimented with showing readers a randomly selected cross-section of our election simulations to demonstrate how our models worked.
asserted
models → experiment → simulations
I’m not sure that quite had the desired effect.
asserted
that → ’m → effect
Our customers tended to scroll through the simulations until they’d encounter one of the weirder maps, and then they’d sometimes use that as a way to express doubt about the forecast.
asserted
they → tend → forecast
But weird things happen in elections.
asserted
things → happen → elections
Barack Obama improbably1 won Indiana in 2008, and then the Hoosier State reverted back to basically where it had always been.
asserted
it → win → 2008
On other occasions, results that seemed weird at the time made more sense in retrospect.
asserted
that → seem → retrospect
Amidst a blue wave, Democratic Senator Bill Nelson lost in Florida in 2018, a state which at the time was only slightly to the right of the electoral tipping point.
asserted
which → lose → point
(Hillary Clinton had barely lost Florida in 2016.)
asserted
Clinton → lose → 2016
Still, let’s give the “show me the maps!” concept one more spin.
asserted
’s → let → spin
This time, we’ll curate things a bit more.2
asserted
we → curate → things
From among the 40,000 simulations that FLIPR ran on Saturday, I’ve chosen 13 scenarios: nine or ten relatively normal cases, and then three or four deliberately weird ones.
asserted
I → run → scenarios
To be fair, that distinction can get blurry.
asserted
distinction → get → ?
We’ll show you one map where Republicans hold the House as well as the Senate, something that’s rather unlikely if you believe FLIPR.
asserted
you → show → FLIPR
In 2024, literally the exact most frequently-occurring map from our simulations “hit”, which involved Donald Trump winning precisely the seven canonical swing states that year but nothing beyond those.
asserted
Trump → occur → those
Often, however, maps are messier than people expect, especially in midterms.
But I’ll try to give you a representative flavor of the sorts of simulations FLIPR is cooking up.
asserted
FLIPR → expect → simulations
They will include nine maps where Democrats flip the Senate and four where they don’t.
asserted
they → include → Senate
There are lots of maps along the lines of “Democrats win 51 Senate seats, not including Texas” and “Democrats win 52 Senate seats, because James Talarico just gets barely over the finish line in Texas.
asserted
Talarico → be → Texas
Still, in curating these, I can’t get the Anna Karenina principle out of my head: “all happy families are alike [but] each unhappy family is unhappy in its own way.”
asserted
family → curate → way
The maps where FLIPR kind of breaks — either there’s a Democratic mega-tsunami, or a polling bust — are more interesting than the ones where the model’s predictions are basically about right.
asserted
predictions → break → ones
There’s also another point that I’ll try to layer in here.
asserted
I → ’ → that
As much as we hope you’ll join us for our Election Night coverage, there’s a reasonably good chance that the midterm outcome, especially in the Senate, won’t be clear by Tuesday night or early Wednesday morning.
asserted
outcome → hope → night
One of the most important Senate races this year is in Alaska, which is slow to count its votes and also uses ranked-choice voting.
asserted
which → count → voting
All of this could get ugly, especially if Mary Peltola wins and Republican Governor Mike Dunleavy refuses to certify the vote.
uncertain
Dunleavy → get → vote
Maine is also a slow-counting state.
asserted
Maine → count → ?
Even if everyone is on their best behavior, in about 20 percent of FLIPR simulations, control of the Senate will come down to exactly one state.
asserted
control → come → state
If the United States “draws” one of those outcomes, and there are recounts, etc., it might take through next weekend or beyond to resolve who wins the Senate.
uncertain
who → draw → Senate
The country has probably been lucky that during the Trump Era, most of the topline results have been relatively decisive: imagine how a replay of 2000 would play out now.
asserted
replay → imagine → 2000
(There’s no provision in FLIPR that accounts for irregularities in tallying the vote.)
asserted
that → ’ → vote
Perpetually tardy California doesn’t play a starring role this year in either the Senate or the House, at least.
asserted
California → play → Senate
Paid subscribers get full access to our Election Night livestream and live blog with updates from our friends at The Argument, GD Politics and Slow Boring.
But these are intended as “morning after” maps — in other words, what we’ll know as of, say, 8 a.m. on Wednesday.
asserted
we → get → Wednesday
Based on some priors about how quickly each state counts its vote, I’ve applied different thresholds in different states toward when a preliminary result might be considered decisive.
uncertain
result → base → states
For instance, in a fast-counting state like North Carolina, I’ll assume that any result that eventually finishes outside 0.5 points, according to FLIPR, will de facto be known as of Wednesday morning, even if it hasn’t formally been “called” by the networks.
uncertain
it → count → networks
In chronically slow-counting states like Alaska or California, I’ll raise that threshold to as high as a 3 percent margin.
asserted
I → count → margin
Thanks to FLIPR’s quasi-omniscience, I’ll show you who will eventually win in each simulation, but 1-2 Senate races, 1-2 gubernatorial races, and roughly a dozen House contests will likely remain ambiguous as of early Wednesday morning.
asserted
races → show → morning
These states and districts will be cross-hatched in yellow, indicating that they project to be close in the chosen simulation.
asserted
they → cros → simulation
The base case
Just to get us started, let me first show you one of those relatively normal maps.
asserted
me → get → maps
For each simulation, I’ve calculated an “upset percentile”.
asserted
I → calculate → percentile
After experimenting with more complicated algorithms3, this calculation is relatively simple.
asserted
calculation → experiment → algorithms3
A race where a candidate who had a 49 percent chance of prevailing wins gets 1 Upset Point; a race where a candidate who had a 1 percent chance pulls a rabbit out of their hat is worth 49 Upset Points.
asserted
who → have → hat
These scores are then averaged out by branch, with the Senate getting 50 percent of the aggregate weight and the House and governorships getting 25 percent each.
asserted
House → average → percent
…and 16 more, not listed.
 The Aporia