 The Aporia
Yao, M. (2026, April 8). Tracking U.S., state and county gas prices, in maps and charts. NBC News. https://www.nbcnews.com/data-graphics/gas-prices-iran-war-state-national-cost-trump-rcna265835
Yao, Melinda. “Tracking U.S., state and county gas prices, in maps and charts.” NBC News, 8 Apr. 2026, https://www.nbcnews.com/data-graphics/gas-prices-iran-war-state-national-cost-trump-rcna265835.
Yao, Melinda. “Tracking U.S., state and county gas prices, in maps and charts.” NBC News, April 8, 2026. https://www.nbcnews.com/data-graphics/gas-prices-iran-war-state-national-cost-trump-rcna265835.
Dated from the outlet's own feed. Check the original for its byline.
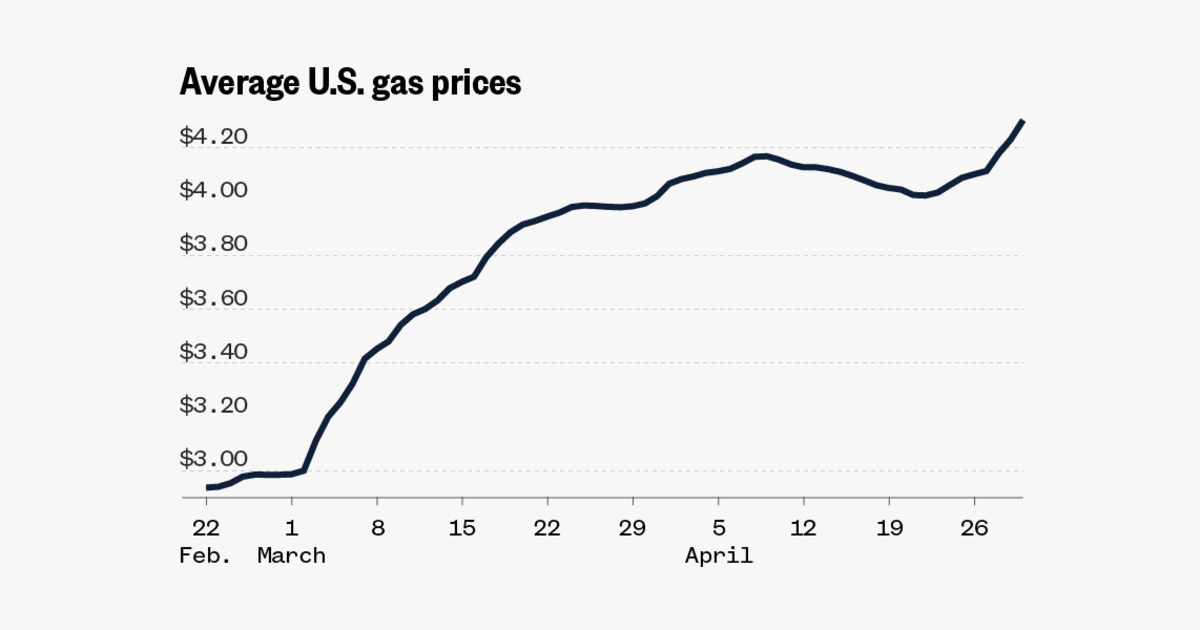
As of April 8, 2026, NBC News is tracking U.S. gas prices at various levels—national, state, and county—and updates daily with new data. Since the start of the war involving the U.S., Israel, and Iran, average gas prices in the United States have increased by more than 40%, reaching over $4 per gallon according to AAA. This price hike has strained household budgets nationwide.
In four states—California, Hawaii, Nevada, and Washington—the average gas price exceeds $5 per gallon. Conversely, Georgia, North Carolina, and Texas pay the least for gasoline. According to a Brown University analysis, the increase in gas prices since the war began has cost Americans over $80 billion. The fluctuation in oil prices, initially spiking then declining before surging again, reflects ongoing instability in the Middle East.
The war in Iran has led to higher prices at the gas pump.
Gas prices in the United States, up by more than 40% since the U.S. and Israel launched the war, have soared as the global oil supply constricts.

